I spend a lot of time working with small and medium developers who are trying to get started on UA, or who have started but have hit roadblocks and face uncertainty about how, where, and how much to spend. Larger developers make performance marketing look complicated and challenging, because at large scale where fractions of a percent can mean whole annual salaries in revenue won or lost, it is
For small and medium developers establishing a UA program, it is a lot simpler just to get started. There are major questions that need to be answered before you build enough scale to start obsessing over every marginal gain.
So - what channels should you advertise on, and what geos should you focus on? The answer depends upon many factors, so seeing where others in your genre (your competitors) have succeeded allows you to take advantage of some of the learning they’ve already paid for.
Below, I describe some of the tools and processes that can help clients evaluate the right channels and geos for their marketing efforts.
Who are these tools for?
These will be especially useful to anyone who’s got a limited budget, or is looking for a place to start.
Larger developers, living in a world where a few percentage shift in CPI could generate tens of thousands in additional revenue at scale, will likely have additional resources to devote to extensive competitor research. But even in that scenario, the kind of research I describe below can help a team save a lot of time by giving some starting points.
These will also be useful if you’ve run through the most common big name ad networks (Meta, Google, etc.) and are trying to choose between the dizzying array of other networks to test on next.
RpD: Benchmarking and geo analysis
Look at revenue over the last 30 days and downloads over the last 30 days. This will tell you how much revenue per download your competitors are getting. This is a useful benchmark because it can help set expectations about average CPIs across networks. If your competitors are making $5 per download, they’re probably not afraid of a $4 CPI.
- This gives you an idea of the general health of your competitor by comparing current RpD to all time RpD. If there’s been a slowdown in growth your competitor may be struggling, look at different time periods to see which networks they’re sticking with and which ones they spin up and scale down in a hurry. Those networks that your competitors abandoned are probably less likely to find your game appealing.
- If you can see other parameters in your tool of choice, try to break it down further. What’s RpD by country? You’re probably most interested in T1 geos. In the example below for Coinmaster note that RpD is highly distorted by a huge volume of installs in Vietnam, which is less than 2% of their revenue. RpD for US is closer to $42, but the overall average RpD appears to be about $12. Typically, you’d want to find networks that have a higher RpD, although variability in CPI from network to network still needs to be factored in to get a complete picture.
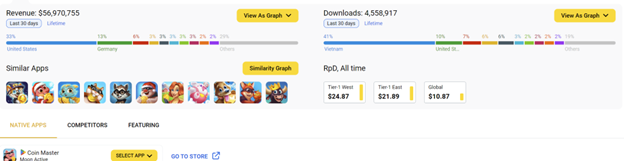
Using my tool of choice, App Magic, please note that RpD is given as ‘all time’, so I’m collecting the data from the chart and doing the math myself. Revenue/Downloads = RpD. Always pay careful attention to how things are labeled!
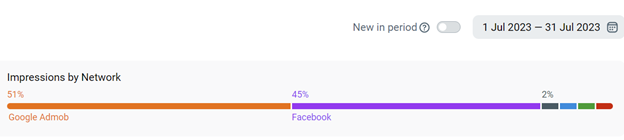
Impressions by network: What networks to focus on?
Looking at your competitors’ impressions by network and country is a good proxy for evaluating their spend on each network. I recommend doing this after you’ve identified some geos you want to target so you know where to focus. As with the example above, including everything in your evaluation indiscriminately can distort what you’re really after.
This is pretty straightforward. Look at the countries you’re interested in, and look at what networks your competitors are using. Networks your competitors invest big in are networks where they’ve achieved positive results, and you should explore whether you can market effectively on those same networks.
The next step is where the analysis gets fun. Jump back a few months, I arbitrarily chose September and July for this example. Look at how things have changed, and what networks they’ve abandoned or added to.
| July | September | November | |
|---|---|---|---|
| Admob (Google) | 15.5M | 9.8M | 1.2M |
| 13.8M | 17.3M | 11.2M | |
| YouTube | 0.5M | 9.3M | 12.8M |
| Unity | 0.2M | - | <0.1M |
| Applovin | 0.2M | 0.2M | 12.3M |
| Ironsource | - | 2.3M | - |
| Vungle | - | 1.1M | 0.4M |
It looks like Moon Active has been evaluating different channels. The point of this post isn’t analysis, but suffice to say that the perceived value of Google has dropped off, and a lot of additional resources have been expended on AppLovin.
Moon Active moved to YouTube in the last few months as well, and seem to have found improvement as they’ve continued to increase spend. Iron Source, Vungle, and Unity look like bad bets, but both AppLovin and YouTube demonstrate why keeping a foot in some of the smaller networks can be valuable as a long term strategy.
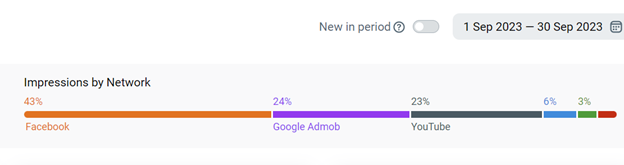
You can see this dashboard here - Don’t forget to continue to look at Country here, not only to focus on what’s relevant to you, but also because you sometimes discover something strange. Here AdMob is barely advertising in the US, and their entire spend on YouTube, almost $13M, has been in France. Have you thought about advertising on youTube in France?
Limitations:
- Crucially - RpD only counts In-App Purchases (IAP). If you can find benchmarks for IAP and Ad Revenue percentages for your competitors you can extrapolate Ad Revenue.
- Another important point is that for a current or very recent period (last 30 days, for example) RpD includes data from previous installs, including those from the previous weeks and months. This means that while you can usually rely on RpD for directional cues, you should remember that it will typically reflect change slowly.
- This approach assumes that your competition is basically competent and pursuing a UA strategy with the same basic goals as you. There’s no proof that Moon Active is right to invest in France… but they certainly seem confident about it.
In Conclusion:
This is by no means the end of the road for this type of analysis, but this process will help starting UA programs determine where to focus and start to get their bearings. For established UA teams this is a good way to look for leads into more obscure networks, geos, and tactics. A lot of the time the results will present multiple possible explanations and courses of action, and you’ll need to do some testing and experimentation, possibly some deep dives into what kind of tactics competitors are succeeding with (creatives, placements, etc.) on those networks.