(This short series is written to give some guidance on the basics of working with game data. It gives you some idea of the fundamentals, such as what data to track and when, how to figure out whether data is actionable or of good quality, as well as a final case study. Get in touch with us if you’d like to know more.)
Data is a great tool for any developer, and learning how to analyze it is invaluable. But data can be imposing to work with. Developers often struggle to know what they should be tracking, when they should be tracking it and whether the resulting data is actionable. Moreover ensuring that data is of consistent quality and accuracy is often a skill in and of itself, and this is one of the challenges faced by developers on a daily basis.
Any event or action in game can be a data hook. From the moment the player installs your game to the instant they unlock their first special weapon, make a purchase or reach level 1000, you can know that that happened. Every interaction, operation, movement of currency, score, win, loss, chat interaction and so much more can be data. But is that required?
Often, the problem that arises from being able to track everything is that a developer ends up overwhelmed, loses track of actionable insights vs. data that is informatory & adds to their analytics costs. As a result, a developer may lose focus on game improvement and data driven decision making and instead spend time focused on game data that does not help with decision making.

Part 1: What to Track
So what should you track? There are some pretty typical metrics that are worth knowing, such as:
- User data
- Device, OS version, game version
- Country, location
- Session beginnings, ends, average time spent in the game etc.
- Demographics such as age and gender
User data gives the developer insight into who is playing their game, which often helps with design, and marketing/user acquisition (UA) decisions. This kind of data can sometimes lead developers into stereotypical, or even cynical thinking, about an audience. That kind of thinking is generally best avoided. But at its most best it can yield key insights about what an audience values. For example if your game is being played by an older audience that might indicate a need for gameplay that isn’t twitch-dependent, or stems from familiar themes already known to the audience. It might also, however, indicate a preference for a certain level of complexity, which can be very helpful.
- Core business performance data
- User installs
- Retention, typically measured across several timespans
- Lifetime value of players
- Revenue, often averaged per day/week, per user, per paying user
Core business data such as active users, retention rates and lifetime value (LTV) tend to be among the most commonly discussed KPIs that define the success of a business and are benchmarked across game genres on various communication forums like conferences, blogs, studios & discussion groups. Stakeholders often want to know these data as a way to frame their thinking about a game’s potential or its shortcomings. So they’re important to know, but rarely do they give deep-enough insight on what to do to improve or optimize a game. Like television ratings, core business data mostly tells us what is and isn’t working, but not why.

- Engagement data
- FTUE (“first time user experience”) completion rates
- Features used or played
- Player win or success rates, depending on the game design
- Spends, earns and wallets (amounts held) of game currencies and other resources
- Progression through levels, puzzles, maps or character levels, depending on the game design
- Response rates to notifications, prompts, referrals
- Monetization conversion, such as currency purchase or subscription rates
Engagement data, on the other hand, tends to give closer insight. This kind of data looks hard at what a player actually does when they play, giving designers clues about how to make the game more fun & challenging based on the average player’s purpose and what they value in the game. It also forms the bedrock of most meaningful experiments (such as A/B testing), building an understanding of common patterns and likely pitfalls, especially if it’s considered on a regular basis. There are limitations, however. Engagement data often doesn’t surface holistic issues well, for example,players not liking the material in a game for aesthetic or cultural reasons. Developers relying on engagement data also tend to assume that what’s presented in a game is structurally sound but not optimized, meaning they get stuck in local maxima – ignoring big issues that are preventing them from reaching new plateaus of success.
- Qualitative data
- Survey results
- Interviews, focus groups etc
- Playtests
- Playstore & Appstore Reviews
That’s where qualitative assessments can sometimes help. While subjective and reliant on the ability of respondents to explain their thinking (which is not always guaranteed), sometimes qualitative data helps a developer understand the truth underneath their engagement data. Such data needs to be treated coolly, however, as it can turn into a form of confirmation bias (in essence the developer only hears what they want to hear). This kind of data should be gathered from neutral parties rather than friends and family, where possible, such sources are invariably biased by wanting to be kind. But with open eyes and a clear head, qualitative can help a developer understand that they have been looking at a problem in the wrong way, or allowing their engagement data to railroad their thinking.
These are fairly standard sets of metrics to monitor, but they should be considered a starting point. Most games have special mechanics or systems that drive how they are played or define their core loops. This in turn tends to make every genre of game somewhat different from every other genre, and also necessitates some bespoke thinking regarding what to measure. Those mechanics and systems sometimes need to be measured in unique ways, to help balance or refine them.
For example, if you wanted to understand why your day-seven (“D7”) retention was poor, the answer might not be apparent from standard metrics. It might be that a particular level introduces a mechanic that’s fun to play but whose score system doesn’t give quite enough reward for the player to progress. It might be that this lack of score is demotivating even when players complete the level, necessitating retries that are boring. That might not be apparent from ordinary metrics of engagement and need a specialized event track to uncover, and the insight to realize that that metric is needed in the first place.
Actually adding such event tracking into a game is usually not that difficult. The difficult part is in clearly defining what is it that you want to measure, and what your baseline expectations are to understand whether the resulting data is typical or atypical. Doing this well usually takes practice. You should always be thinking about what to measure, and whether what you’re measuring can improve your understanding of the gameplay & lead to data driven decision making, and this will help build your skill in doing so over time.
Part 2: How to take Measurements
Most data hooks trigger from either a user action or game event. For example, to capture the number of users entering into an in-game store, you could track every time they clicked on the store icon, or followed a notification about a new item added to the store. You could also measure how many times users returned to the store in a session, a day, a week etc, and even get a sense of whether your user population contains a few very active store-visiting users, or whether store visitation is a common occurrence. Capturing this particular type of data whenever it occurs usually makes sense because it relates directly to monetization.
However, some other data sources can or should only be collected only at a particular frequency. This prevents massive data dumps, where an event generates so much information that it becomes impossible to make sense of. For example, tracking changes in player stats might happen so often that you only want to check for changes a few times a day, to avoid having the event generate so much data that it overloads you. Keeping such data clean and in a usable format really helps when evaluating its worth.
It’s also important to consider data in relation to the maturity of a game. For example, if your game is still in beta then data is often muddied by balance changes, technical instabilities, A/B tests, or feature polishing. And so comparisons across game versions create the possibility of making large errors in analysis. Games in beta also often attract slightly different audiences than launched games, and sometimes player activity in beta can skew assumptions about how players will behave post-launch.
Even post-launch data sometimes needs to be considered in this way. It’s very common for mobile games to soft-launch in smaller territories like Ireland or New Zealand, for example, to see how a sample population reacts to them. This allows developers to judge what changes might need to be made before they launch into much larger and more expensive markets like the USA and spend a lot on user acquisition. From a data perspective this practice is often very helpful, but the developer should have a sense of what they’re trying to measure and what’s not super important to know during this phase.

At the alpha/beta phase analysts are often looking to ensure that the data is being generated correctly for the major KPI triggers like install, DAU, purchase, etc. For soft launch the goal is to validate KPIs and create benchmarks to test whether the product will be stable and sustainable. Hence metrics pertaining to player engagement, FTUE funnels, etc. should start to be tracked. But at this phase it’s probably futile to spend a lot of time trying to understand the finer lifetime value of the soft launch audience (because the game is too new), or get too specific about audience segmentation.
Some metrics simply have to wait until a game has matured enough to have generated enough data. Once the game has matured, more complex and intricate data can help find opportunities to grow KPIs, such as current win to loss ratio of fight systems, assets in player inventory, user preferences from multiple live events, etc. But it’s rare to be able to achieve that in the early days.
Now that you know what data to collect and have some idea how to collect it we’ll next cover how to determine if your data is useful and how to make use of it in part 3.
Part 3: Considering the Usefulness of the Data
Quality not quantity
As we discussed previously, game developers sometimes feel a need to measure all possible events, thereby generating huge spreadsheets and requiring dashboards to dissect the resulting data. Often, however, the result can be incomprehensible.
While data and analytics are central to the growth strategy of all companies, gathering excessive data often leads companies to treat all possible data equally, leading to the usual “big data” problems. That is, way too much data for anyone to make sense of, and requiring ever more complex methods of analysis to understand it.
Avoiding analysis paralysis
Big data is generally beyond the means of most game companies to employ and, although fashionable in tech circles, is rarely continuously monitored or audited for errors or completeness. It also tends to lead to further problems such as higher storage costs, data security vulnerability, inconsistency of data quality between (many) diverse sources, as well as general analysis paralysis. Also, perhaps unsurprisingly, finding data experts who have the knowledge and capacity to work with big data like this is rare and expensive, and usually beyond the means of most game projects.
What is more, it is very easy for developers to lose focus and become obsessed with side issues, such as understanding why their game is only popular in certain regions of the world, rather than, say, investigate why day-three retention seems to crater. Such a glaring mistake is always going to happen if their dashboard is so complicated that key retention data is buried under dozens of pie charts.

Some information is more meaningful (and actionable) than other information.
Asking the right questions
This is why good stakeholders often ask a key question: “Is this data actionable?” They understand that having lots of data is not the same thing as having useful data, and that over-measuring on the wrong indicators often leads developers to incorrect conclusions.
Going back to basics for a moment, what does “actionable” actually mean here? In essence, it means that a particular set of data clearly points towards the need for a particular change in a game.
Actionable data generally identifies, beyond a reasonable doubt, the source of a particular problem and the actions that can be taken to fix it. It often directly relates to what is being measured as a result, usually engagement data backed up with clear-eyed qualitative data, and sometimes with specialized measurements of key events.
Actionable data can also have a timing component. It is always important to know clearly why you are tracking a given metric at each given stage and what you are looking for. For example, suppose a developer tracks user allocation to experimental variants of their game during A/B testing. This data can be helpful in understanding user activity in different variants and determining which variant performs best. Beyond A/B testing, however, it is unnecessary to continue to track such assignments as we already have our conclusion and the data no longer serves a purpose. It is no longer actionable.
Raw data is not always actionable by itself: we often need to ask deeper questions until the data offers an unambiguously useful conclusion. This can require sophisticated analysis (for example, accounting for bias, or considering how one set of events might correlate with another) and therefore considerable analytical skill. However, analysis carried out with a clear focus on a desired objective that will benefit the product is never wasted.
While non-actionable data serves a valuable purpose in reporting to stakeholders (such as puzzles solved in a day, ads watched, etc. which show how the game is performing), you should strive to keep data actionable.
In our next section we will cover how to verify the quality of your data, and how to handle keeping your data well organized and usable once it’s been collected.
Part 4: Ensuring Data Quality
In addition to knowing what, when, and why to keep track of types of data, it’s important to be able to ensure its quality. You should be checking this on an ongoing basis, analyzing new data hooks, performing sense checks and continuously monitoring to catch broken, incorrect or incomplete data. Some of the most common ways of doing this involves techniques such as:
- Resolving redundant data. This means checking for duplicate records or multiple data hooks tracking the same information.
- Checking for sparsely populated data. This means checking for data hooks that generate empty records.
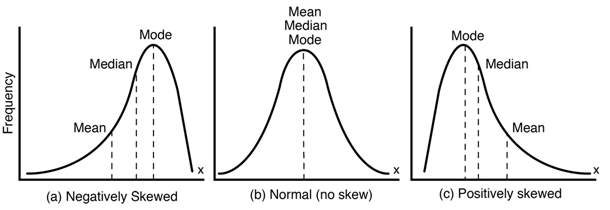
- Checking for skewed data. Skewed data is usually an indicator of problems in the value range for the variable being tracked. Regular sense checks, comparing data from 1st & 3rd party dashboards and doing a simple mean & standard deviation exercise can help eliminate skewed data.
Another aspect of checking data for quality is understanding the impact of significant changes. Sometimes, for example, a major balance shift across a game’s economy means that the current spread of events being used to measure engagement become irrelevant. For example, a change in design meant to create more frequent, shorter sessions could invalidate your previous session length metrics. It’s important to check, to understand why and what you might need to do to recapture the metric in a different way.
Another version of the same issue sometimes arises when developers publish a new game but use a data model from an older game to evaluate it. Sometimes this works well, especially if the two games are in the same genre and target market. But it generally does not work out if either genre or target market are different. Suppose that you had previous success with a roleplaying game and decided to release a competitive shooter next. Do you think you should measure the performance of that new game by the same measures as your big hit? Probably not. You might be surprised at how many developers understand that in theory but don’t do it in practice. They try to compare apples to oranges, and of course the results and therefore the data driven decisions made are incongruent
Finally, get used to keeping and maintaining a “data dictionary” as this helps to preserve data quality. A data dictionary is a simple reference-able document that a developer keeps that lists out what a game is measuring. It often looks like a table with these headings:
| Source | Event name | Trigger | Table schema based event definition | nuances | Examples | Date of implementation |
|---|
Keeping such a dictionary can help your data from becoming a black box, a system that nobody really understands. Game developers can often end up generating terabytes of data, and that data can atrophy. It can come from various sources with definitions of the metric that may not be standardized, for example, with hooks placed by employees who no longer work at the company.

It’s amazing how quickly that can happen, leaving new employees in the position of treating the data as a mysterious engine that seems to behave in weird ways. Without a data dictionary it can be a tedious task for an analyst to hunt through multiple tables and millions of events and records to find just the right ones, and often it can lead to dead ends or frustration.
Keep a data dictionary, and keep it maintained. Standardize event naming both in the dictionary and the game so that it keeps consistency. Archive old analyses with change logs to build context. Create a repository of commonly used queries, so that they are consistently used by team members across their employment life cycle, rather than rolling subtly different versions of their own.
Knowledge management starts with data quality, and for that a consistent data dictionary is key.
In our next data basics post we’ll tie together everything we’ve gone over in parts one through four and look at a case study to learn how to apply these techniques and advice. Stay tuned!